
This post is also available in:


In this article, we’ll take a look at the Samba dashboard. We’ll show you what information you can get from the Dashboard and how to search for specific results.
The entire dashboard consists of 4 sections:
- Summary
- Channel’s attributions
- One-off campaigns
- Automation
Each of these sections will provide you with important information about the functioning and performance of both your store and Samba.
The results the dashboard shows you are for the period you select. You can always set the time span in the top right corner.
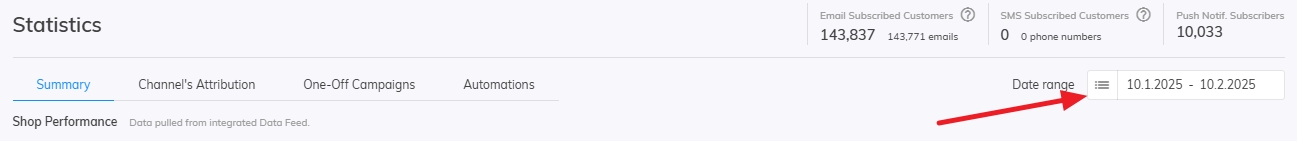
Summary
The home page of the dashboard displays overall statistics about your e-shop’s performance and marketing performance.
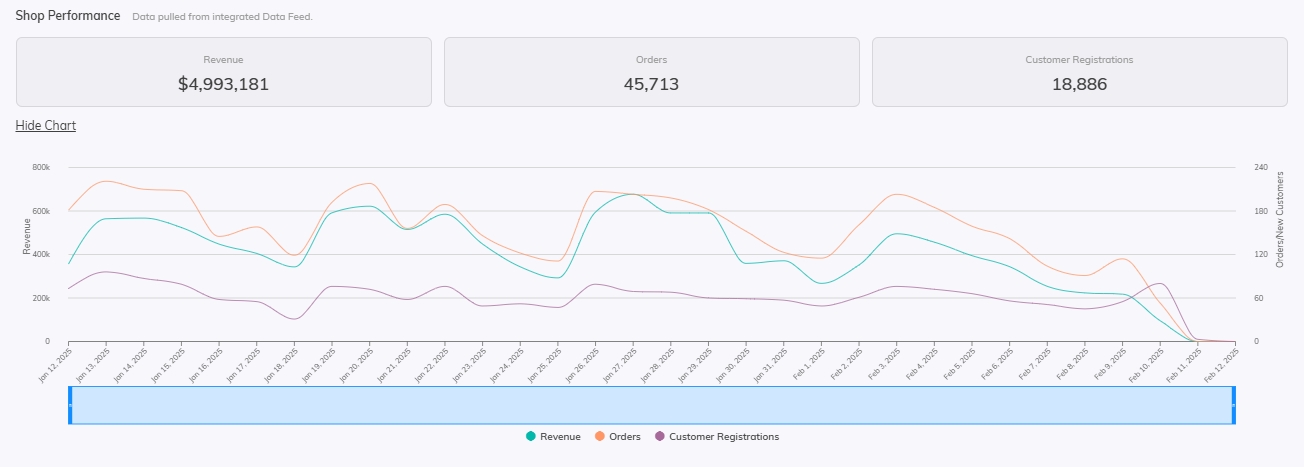
Shop Performance
This is where you project the data that Samba gets from your data feeds.
Here you can see your store’s statistics in the selected date period:
- total sales,
- the number of orders placed,
- the number of new customers registrations.
Using a graph, you can view the evolution of these statistics over time, along with the value breakdown for each time period.
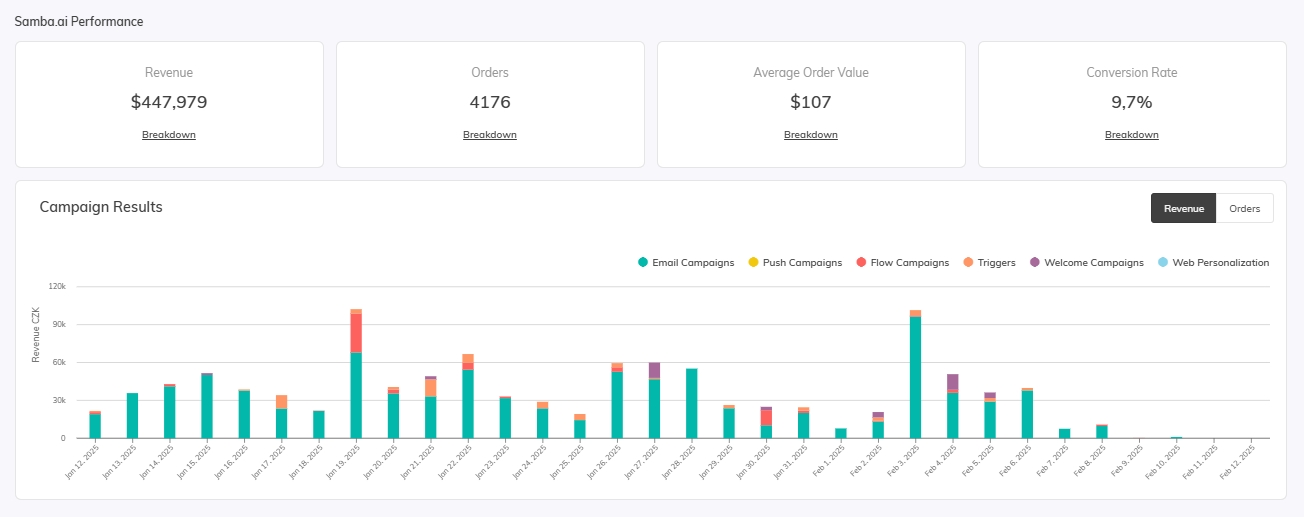
Samba.ai Performance
Marketing performance displays data based on your Conversion Analysis Method. Only web personalization has its own attribution model.
Here you can find
- total sales,
- number of orders,
- average order value,
- conversion rate.
For each of these items, you can also view the breakdown of the tools used (e-mail campaigns, triggers, push campaigns, welcome campaigns, web personalization and so on).
The following chart shows the daily performance of each campaign you are using in Samba.
Channel’s attribution
The next section of the dashboard is the return rate section. You will find performance summaries for each feature within Automation and One-Off Campaigns.
For each of the features, you will find the revenue that the feature has generated for you, along with the total number of orders.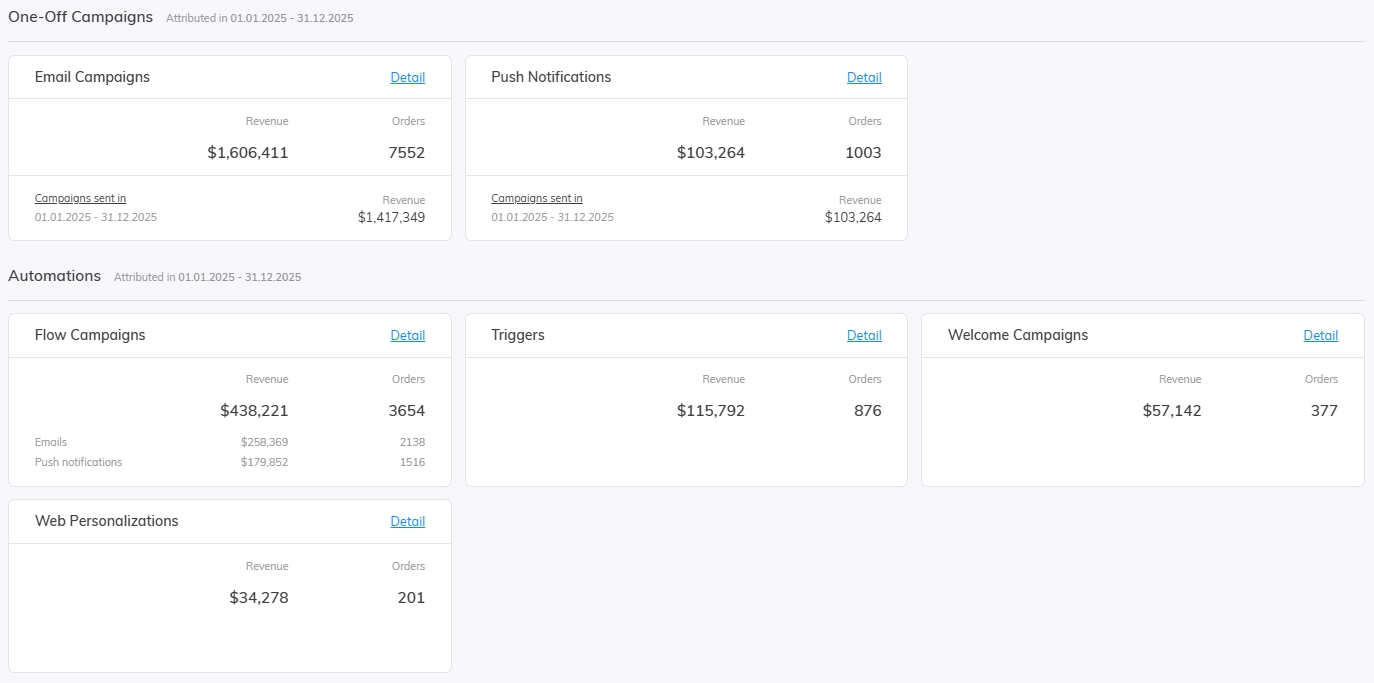
There can be a difference in the data for one-off campaigns depending on specific tabs. Let’s check the e-mail one-off campaigns between January 1, 2024, and January 31, 2024.
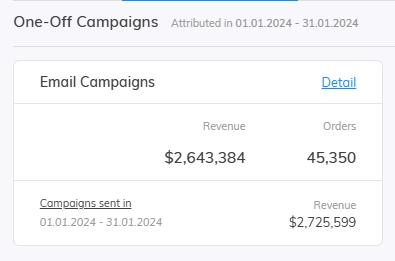
There are two different revenue views.
- The first is based on all conversions made from one-off email campaigns in the selected period from 1 January 2024 to 31 January 2024, regardless of when the campaign was sent. This figure matches the data on the Summary tab.
- The second value, on the other hand, represents revenue from conversions attributed to campaigns which were sent in the selected period between 1 January 2024 and 31 January 2024, but the conversions themselves could have been made at any time. This figure matches the data on the One-off Campaigns tab.
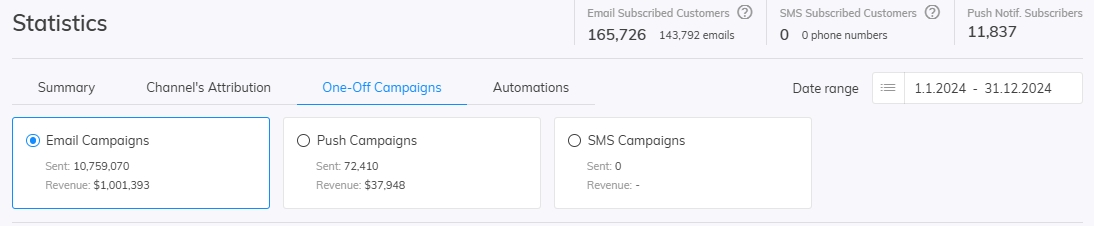
One-off Campaigns
In this section, you will find a signpost to detailed statistics for email campaigns, push campaigns and SMS campaigns along with a basic view of the total number of messages sent and revenue generated.
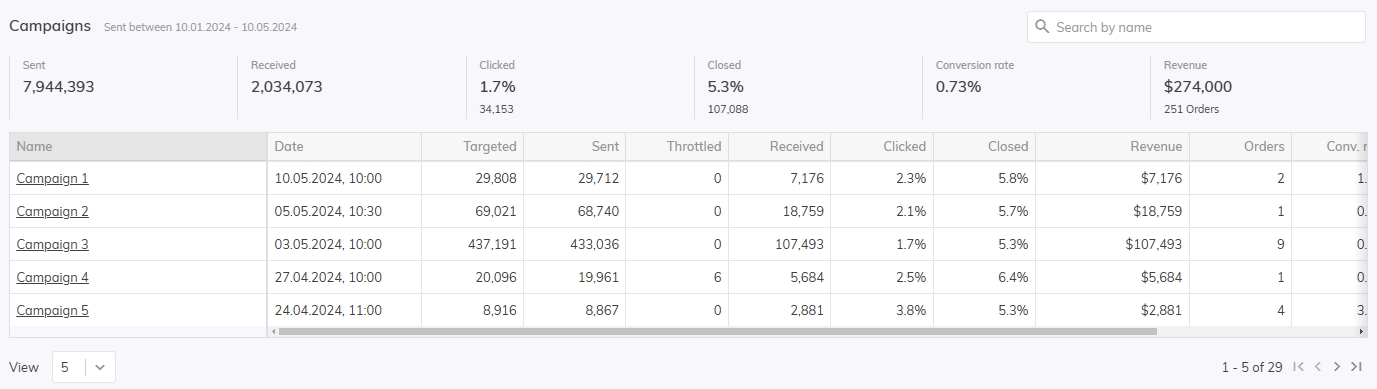
Email campaigns
In the detailed view of email campaign statistics, you can find information on:
The sent campaigns are then displayed in a table with a detailed breakdown per campaign and other detailed statistics such as Campaign Type, Date, Number of Orders or UTM.
 Detailed performance of a one-off Email campaign can be viewed by clicking on the Subject. Read more here.
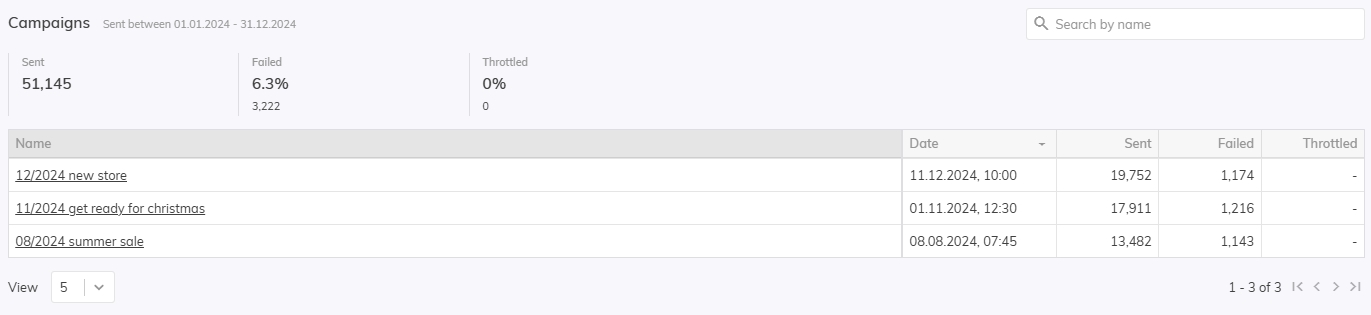
Push campaigns
In the detailed view of push notification statistics, you can find information at the top about:
Sent campaigns are then displayed in a table with a detailed breakdown per campaign and other detailed statistics such as Date, Number of Customers Targeted, Number of Customers Throttled, Number of Orders or UTM.
 The detailed performance of a Push Campaign can be viewed by clicking on the Name. Read more here.
SMS campaigns
Sent SMS campaigns are displayed in a table with a detailed breakdown per campaign and these detailed statistics:
 The detailed performance of an SMS campaign can be viewed by clicking on the Name. Read more here.
Automation
The Automation section, like the One-Time Campaigns section, will show you detailed statistics for each campaign within Samba’s automated features. The top signpost links to detailed statistics for flow campaigns, triggers, welcome campaigns and web personalization along with a basic view of the total number of messages sent and revenue generated.
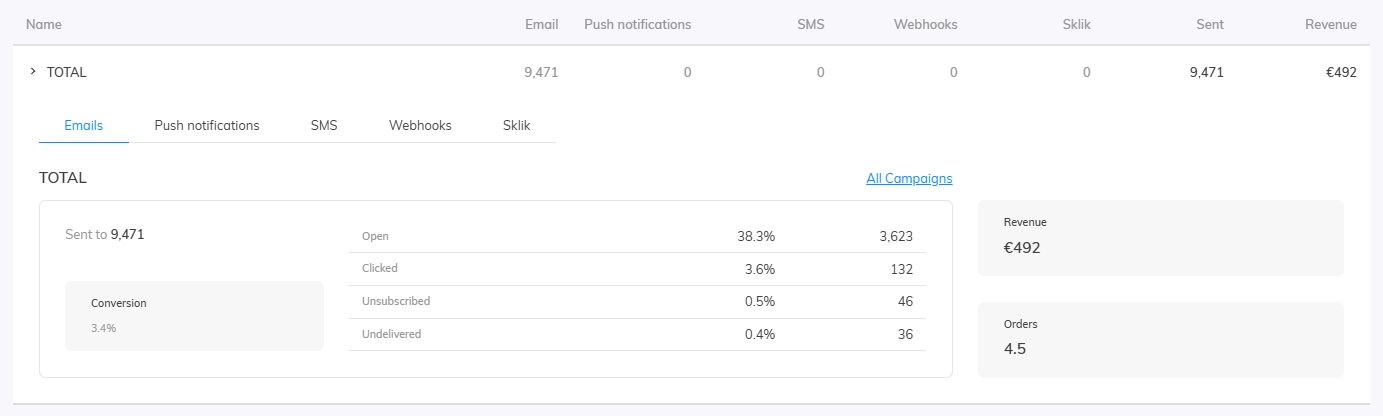
Flow Campaign
The flow campaigns detail view provides a listing of all your flow campaigns along with the total number of messages sent and revenue generated for each campaign.
The campaigns can be further drilled down to the detail view, where you will see a breakdown of the different communication nodes that can be used in flow campaigns (Email, Push Notifications, SMS, Webhooks, Sklik).
Detailed performance statistics are then displayed for each communication node.
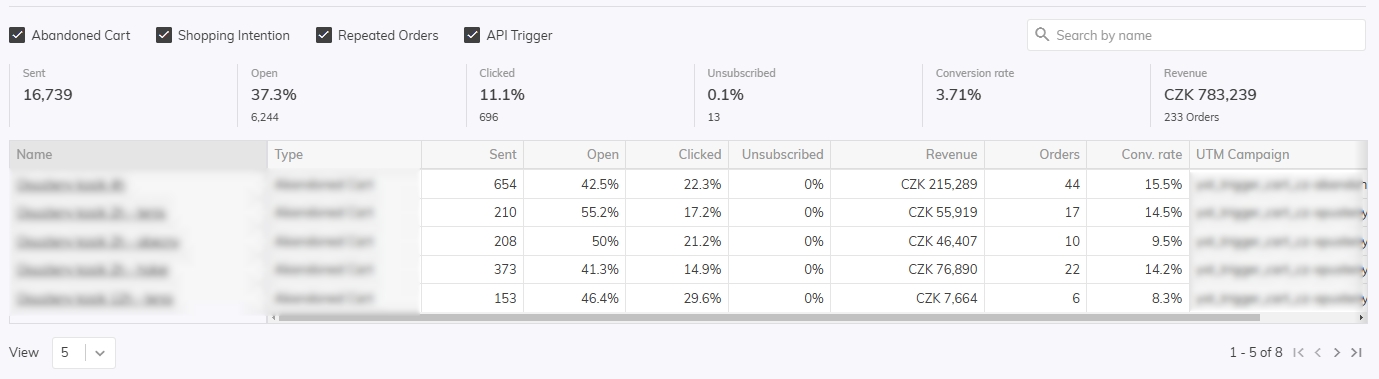
Triggers
In the case of triggers, you will see the same detailed statistics as, for example, Single Email Campaigns. So for each campaign, you will see the Number of emails sent, Open rate, CTR, Revenue etc.
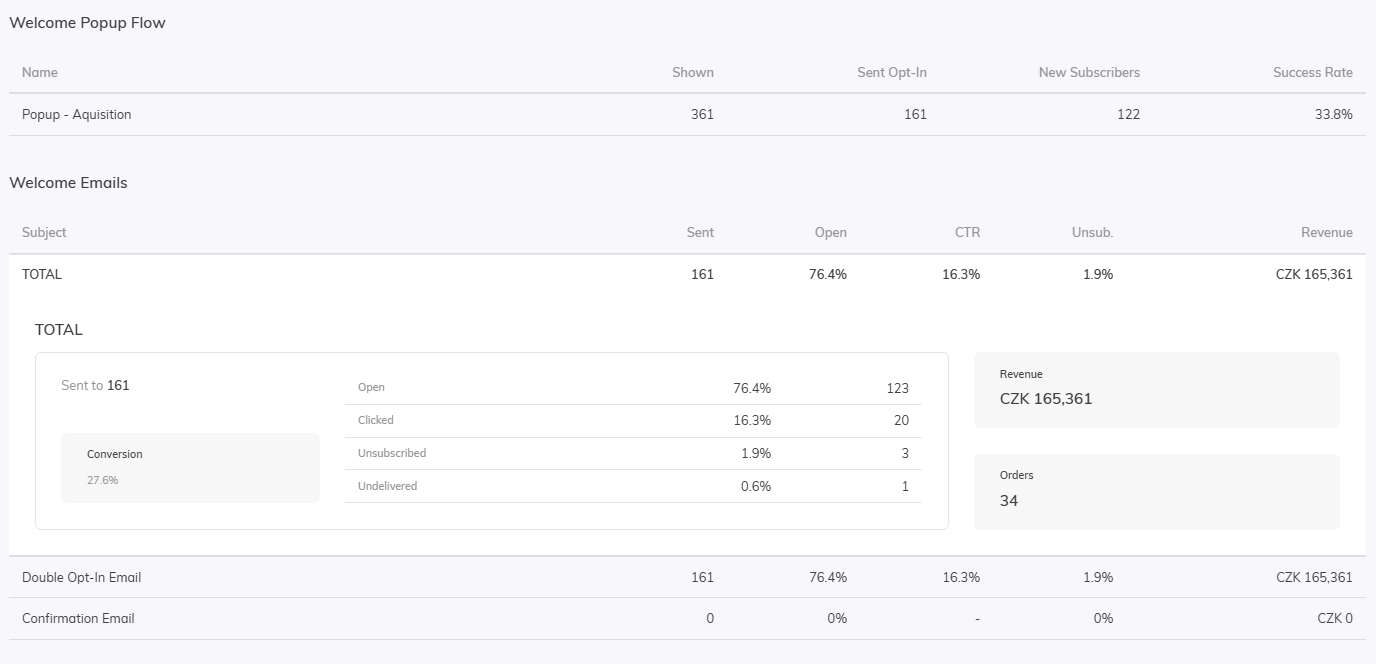
Welcome campaigns
The statistics of welcome campaigns will give you an idea of the performance and functioning of your welcome popup.
Here you can see, for example, how many times your popup has been shown to customers, how many new customers it has brought you, and detailed statistics on welcome emails.
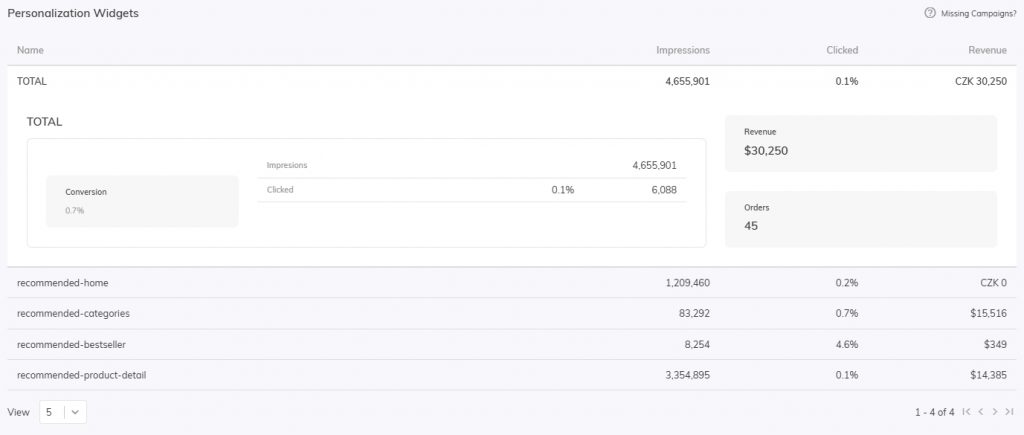
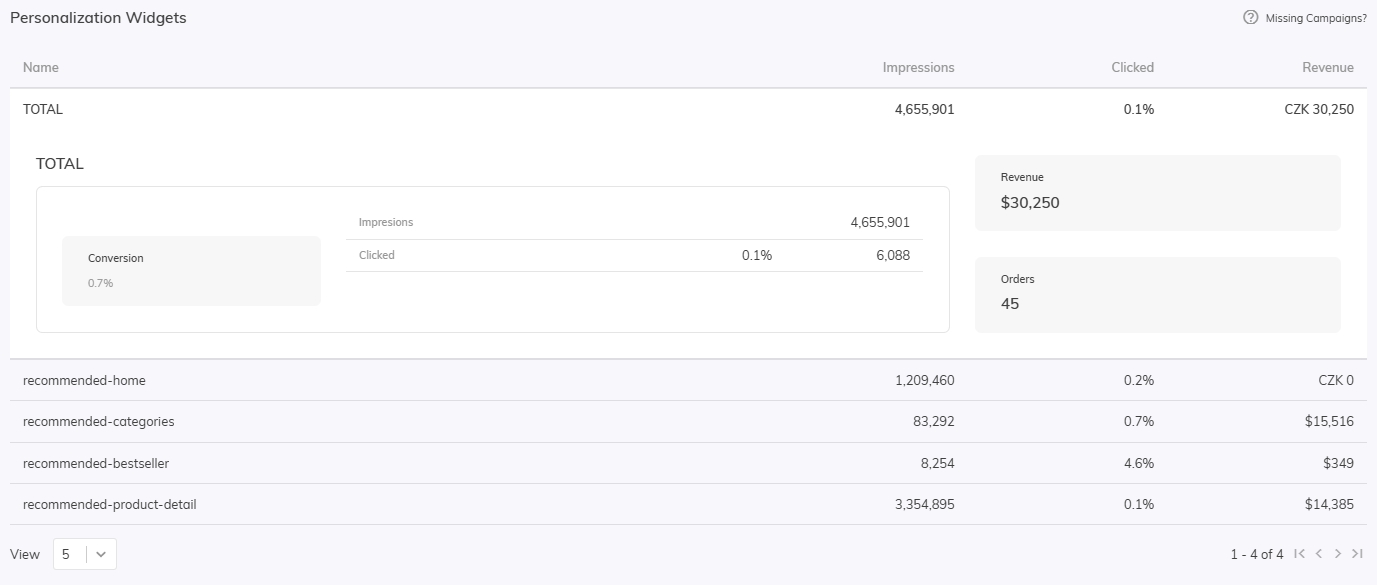
Web personalisation
Whether you create a web personalization widget in Samba or a custom one that you then just call our personalization on, Samba will always show you how your personalization is performing.
For each widget, you can see:
- Impressions: how many customers your widget has been shown to
- Clicks: how many customers clicked on your widget
- Orders: the number of orders placed
- Revenue
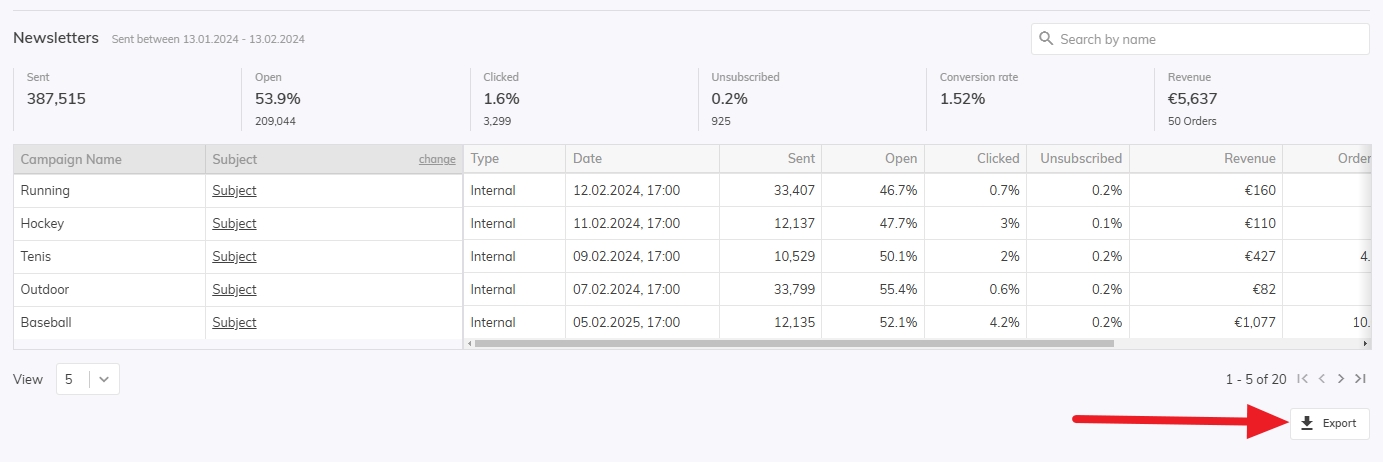
 Export
You can also export your campaign statistics directly from the dashboard. Within the following sections of the dashboard, you will find in the bottom right corner the option to download the export in CSV format.
- Email campaigns
- Push campaigns
- SMS campaigns
- Flow campaigns
- Triggers
This post is also available in: