
This post is also available in:


Samba Business Insights is an advanced set of reports in PowerBI focused on analyzing and processing data from different segments of your business.
Extensive data analysis plays an increasingly important role in the success of your project in highly competitive environments such as e-commerce. It is possible to collect vast amounts of data, but it is necessary to evaluate this data efficiently and correctly to turn it into insights that help determine better commerce strategies leading to increased sales, improved customer acquisition and higher customer retention. With this analytics layer, you’ll be able to make the most of Samba’s features.
Main Page
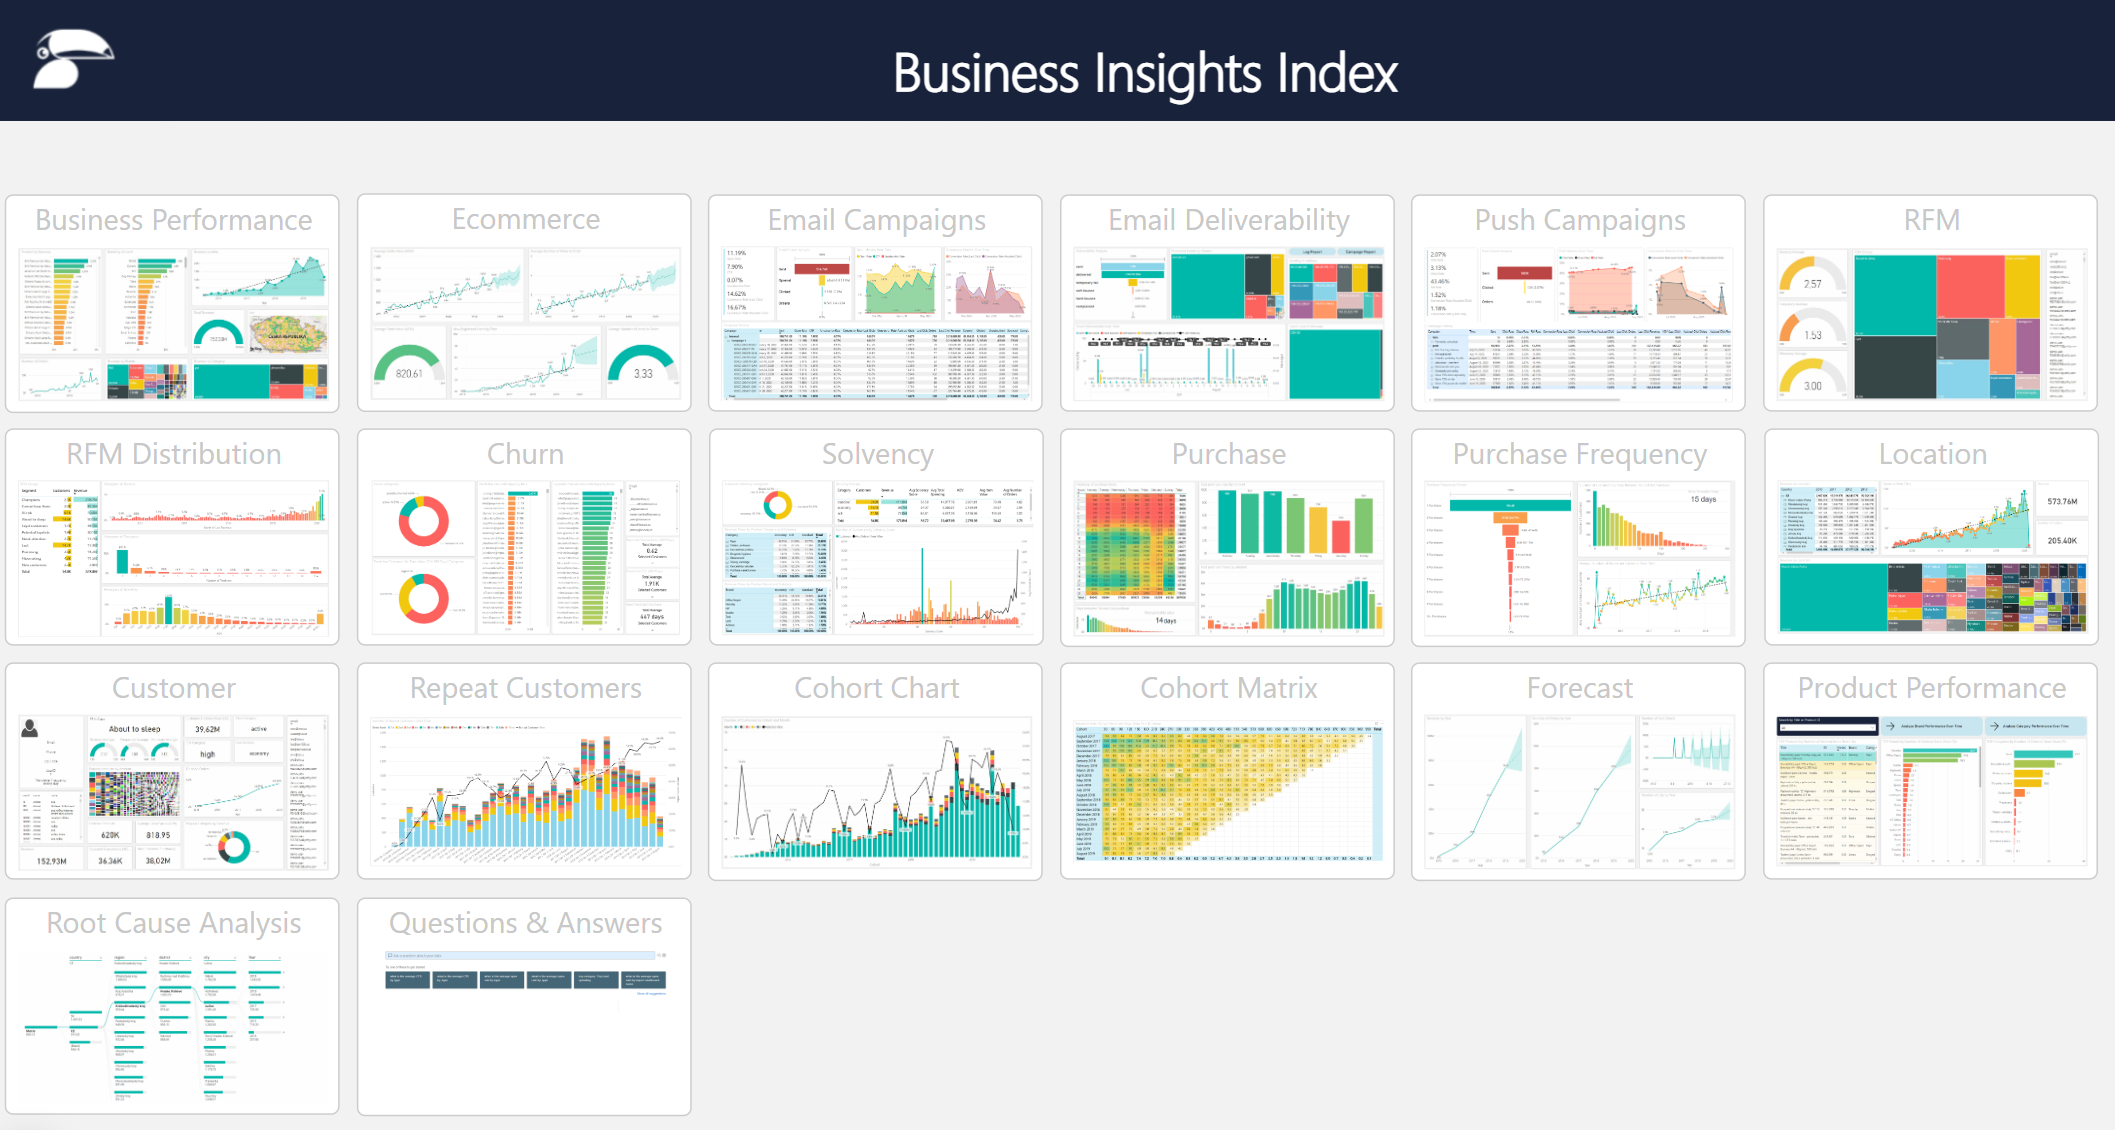
In the following, we will describe a few selected reports.
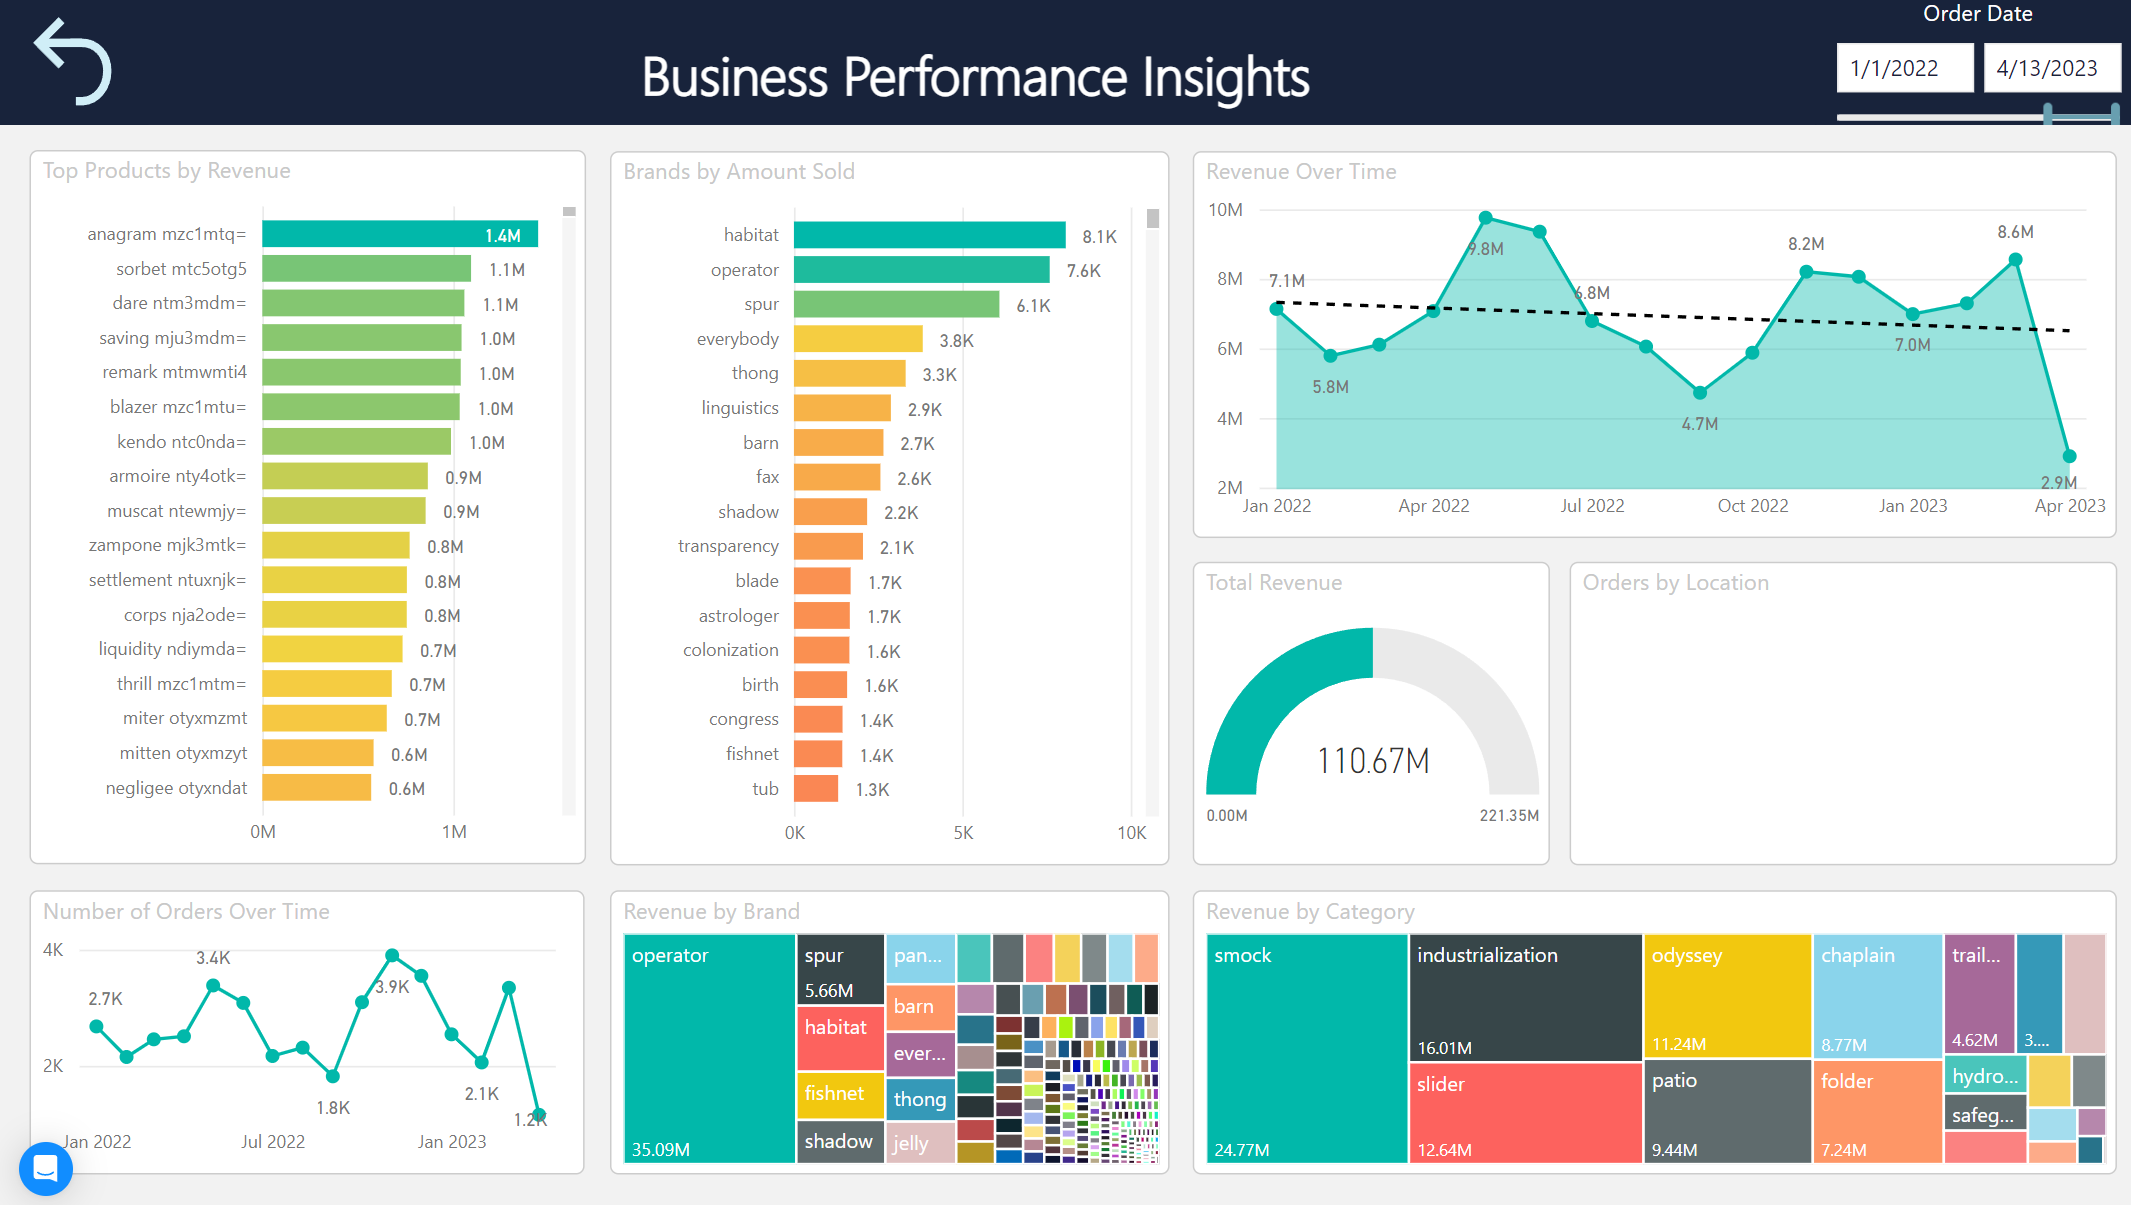
Business Performance
Here you can find an overall overview of your e-shop performance. Here you will find reports such as
- Top products by sales
- Brands by units sold
- Sales development over time
- Sales by brand
- Number of orders over time
- Revenue by product category
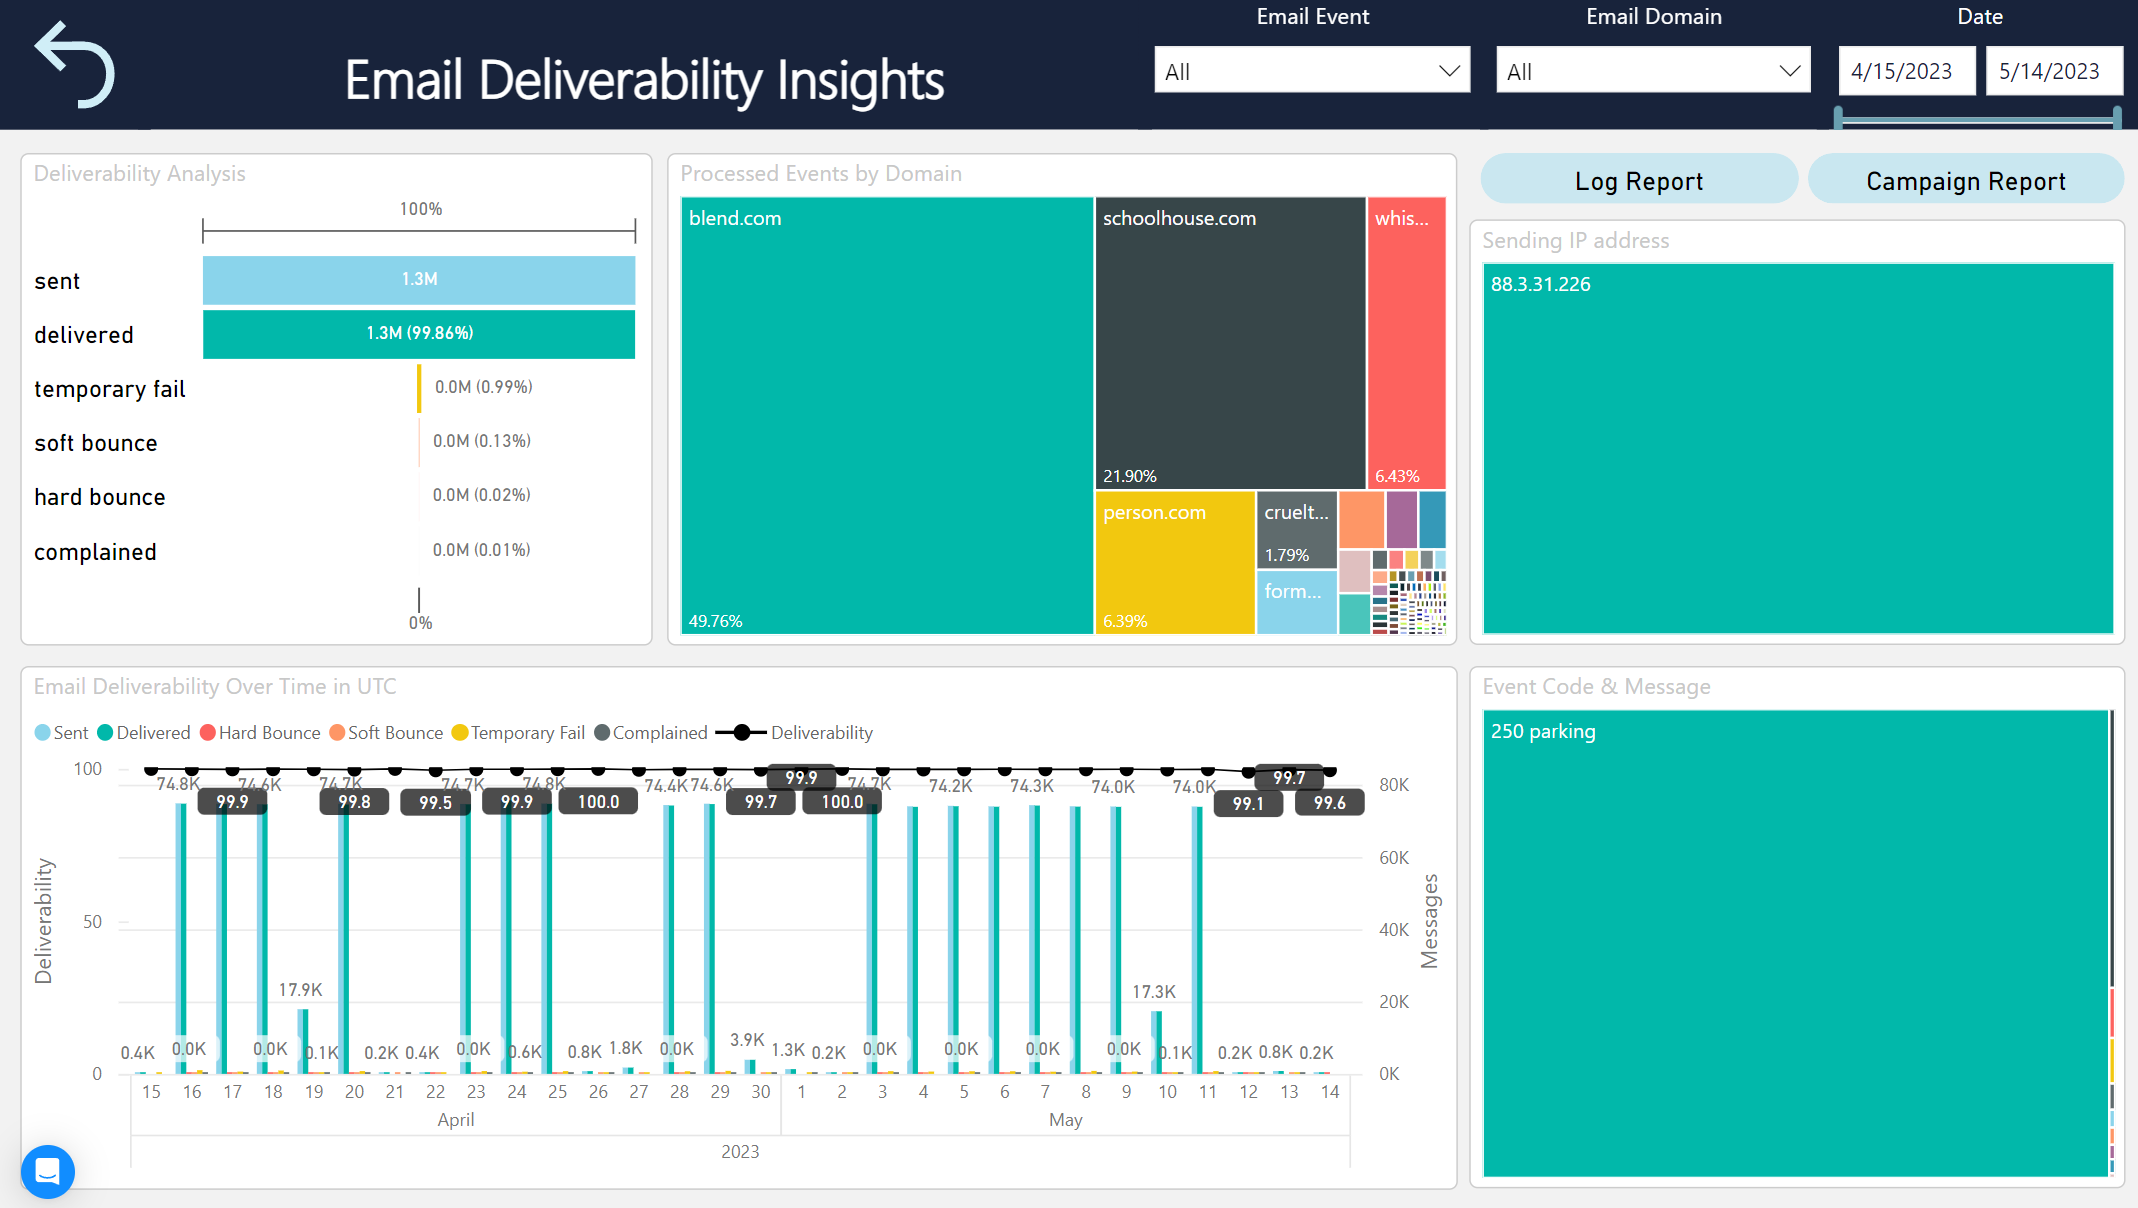
Email Deliverability
Within this section, you have the opportunity to analyse the deliverability of your emails in depth. Here you can find a detailed analysis of the number of emails by their status. I.e. sent, delivered, soft/hard bounce rate etc.
Furthermore, you have an overview of specific domains and their numerical representation in your database. Likewise, you can analyze in detail the evolution of your deliverability over time, including a view across individual sending IP addresses.
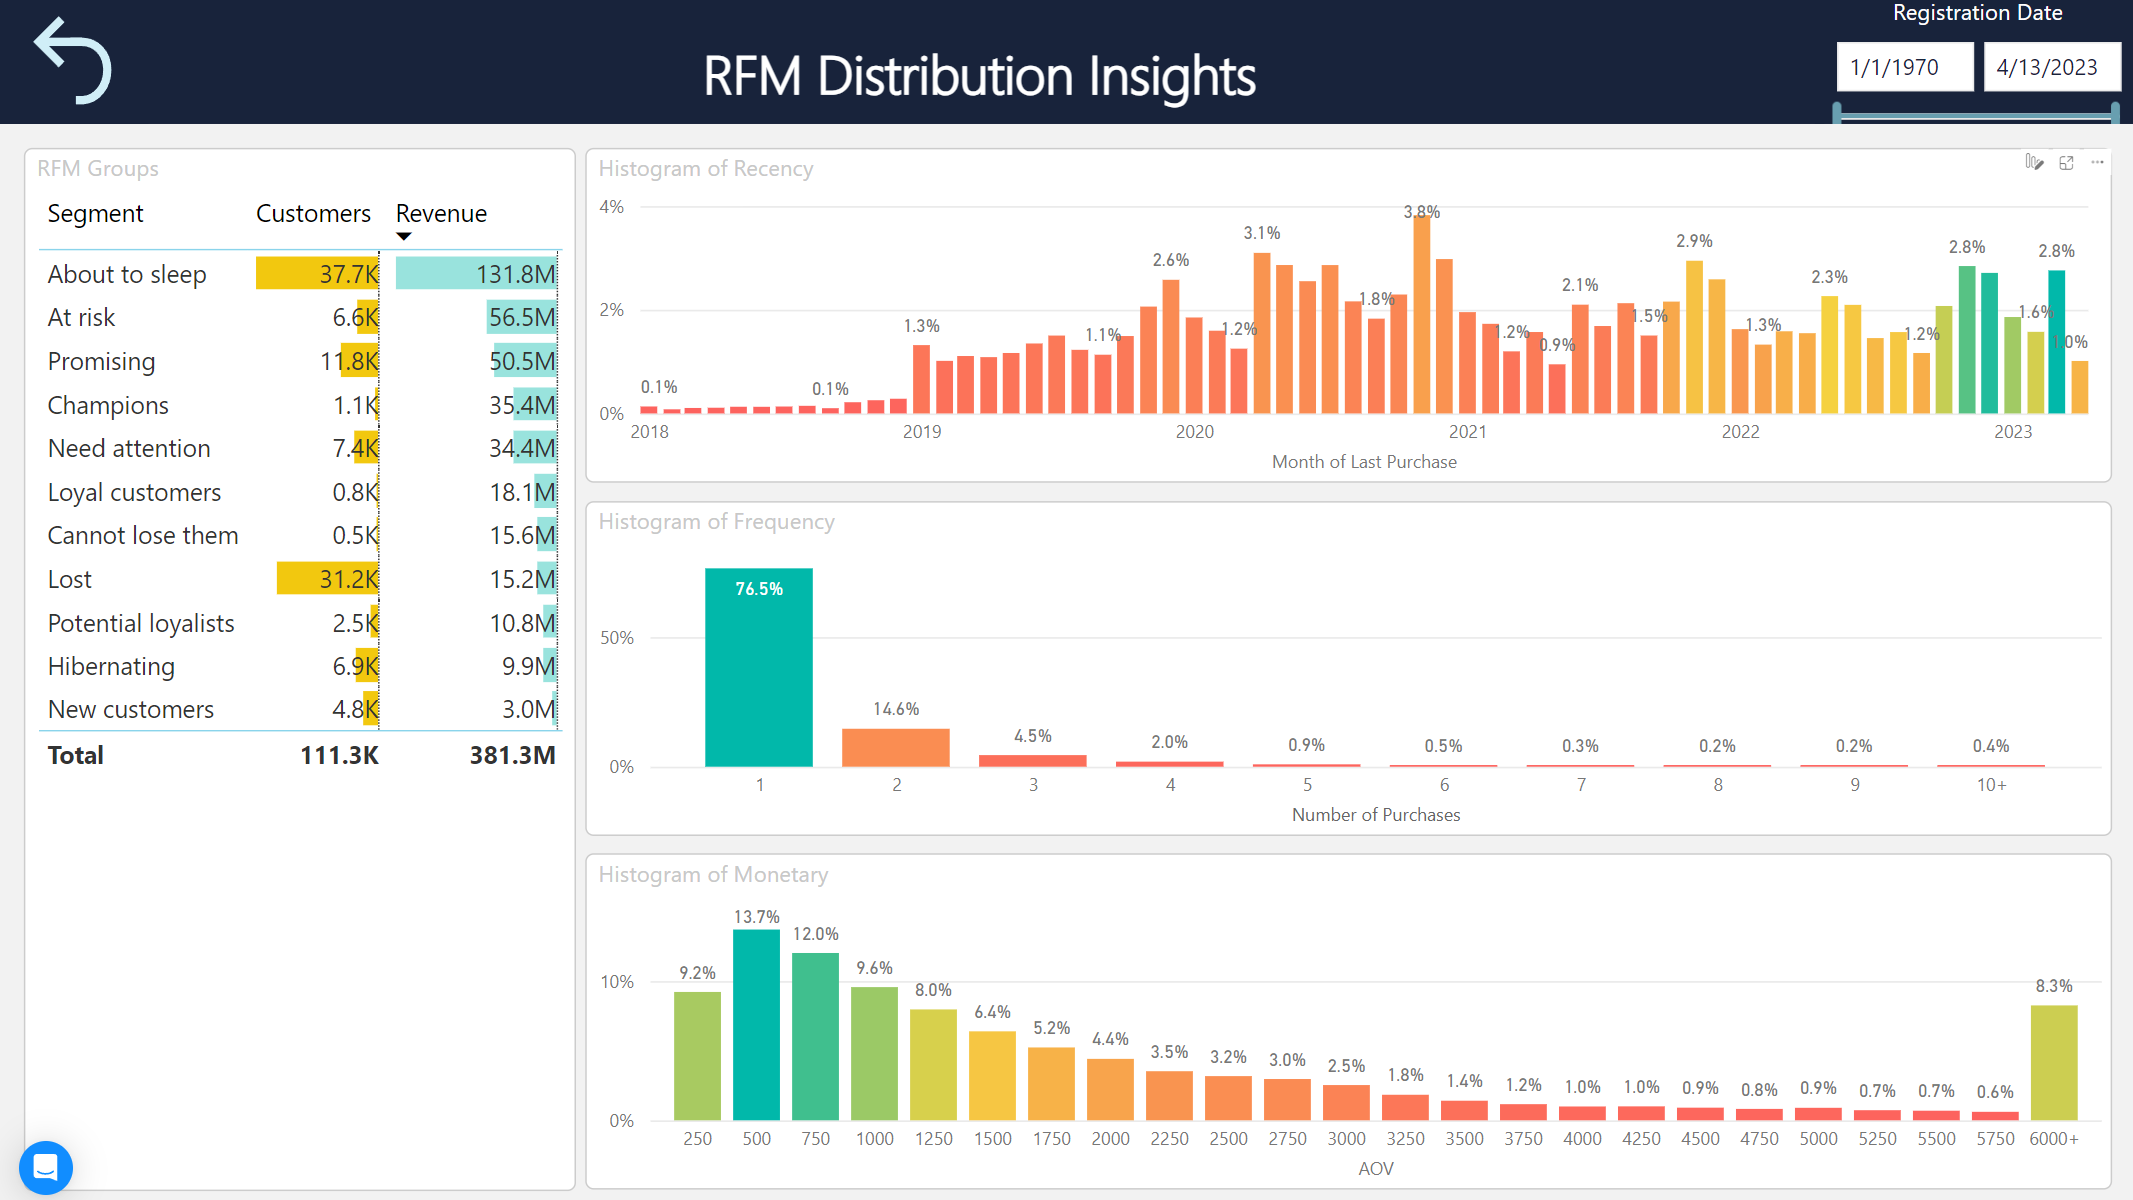
RFM Distribution
RFM is an advanced marketing methodology focused on evaluating the value of your customers.
Samba assigns each customer a score based on their activity in your store. It then categorizes customers into groups based on that score. You can use these attributes as part of your customer filtering.
In this report, you can track the statistics and development of each customer group in detail. This gives you precise information about how many customers are in a given group and what kind of sales that group represents for you.
You will also find histograms that explain the behaviour of these customers in more depth when you label a given group:
- Development of the number of orders by number of customers
- Average order value
- In which month the last order was placed for a specific number of customers
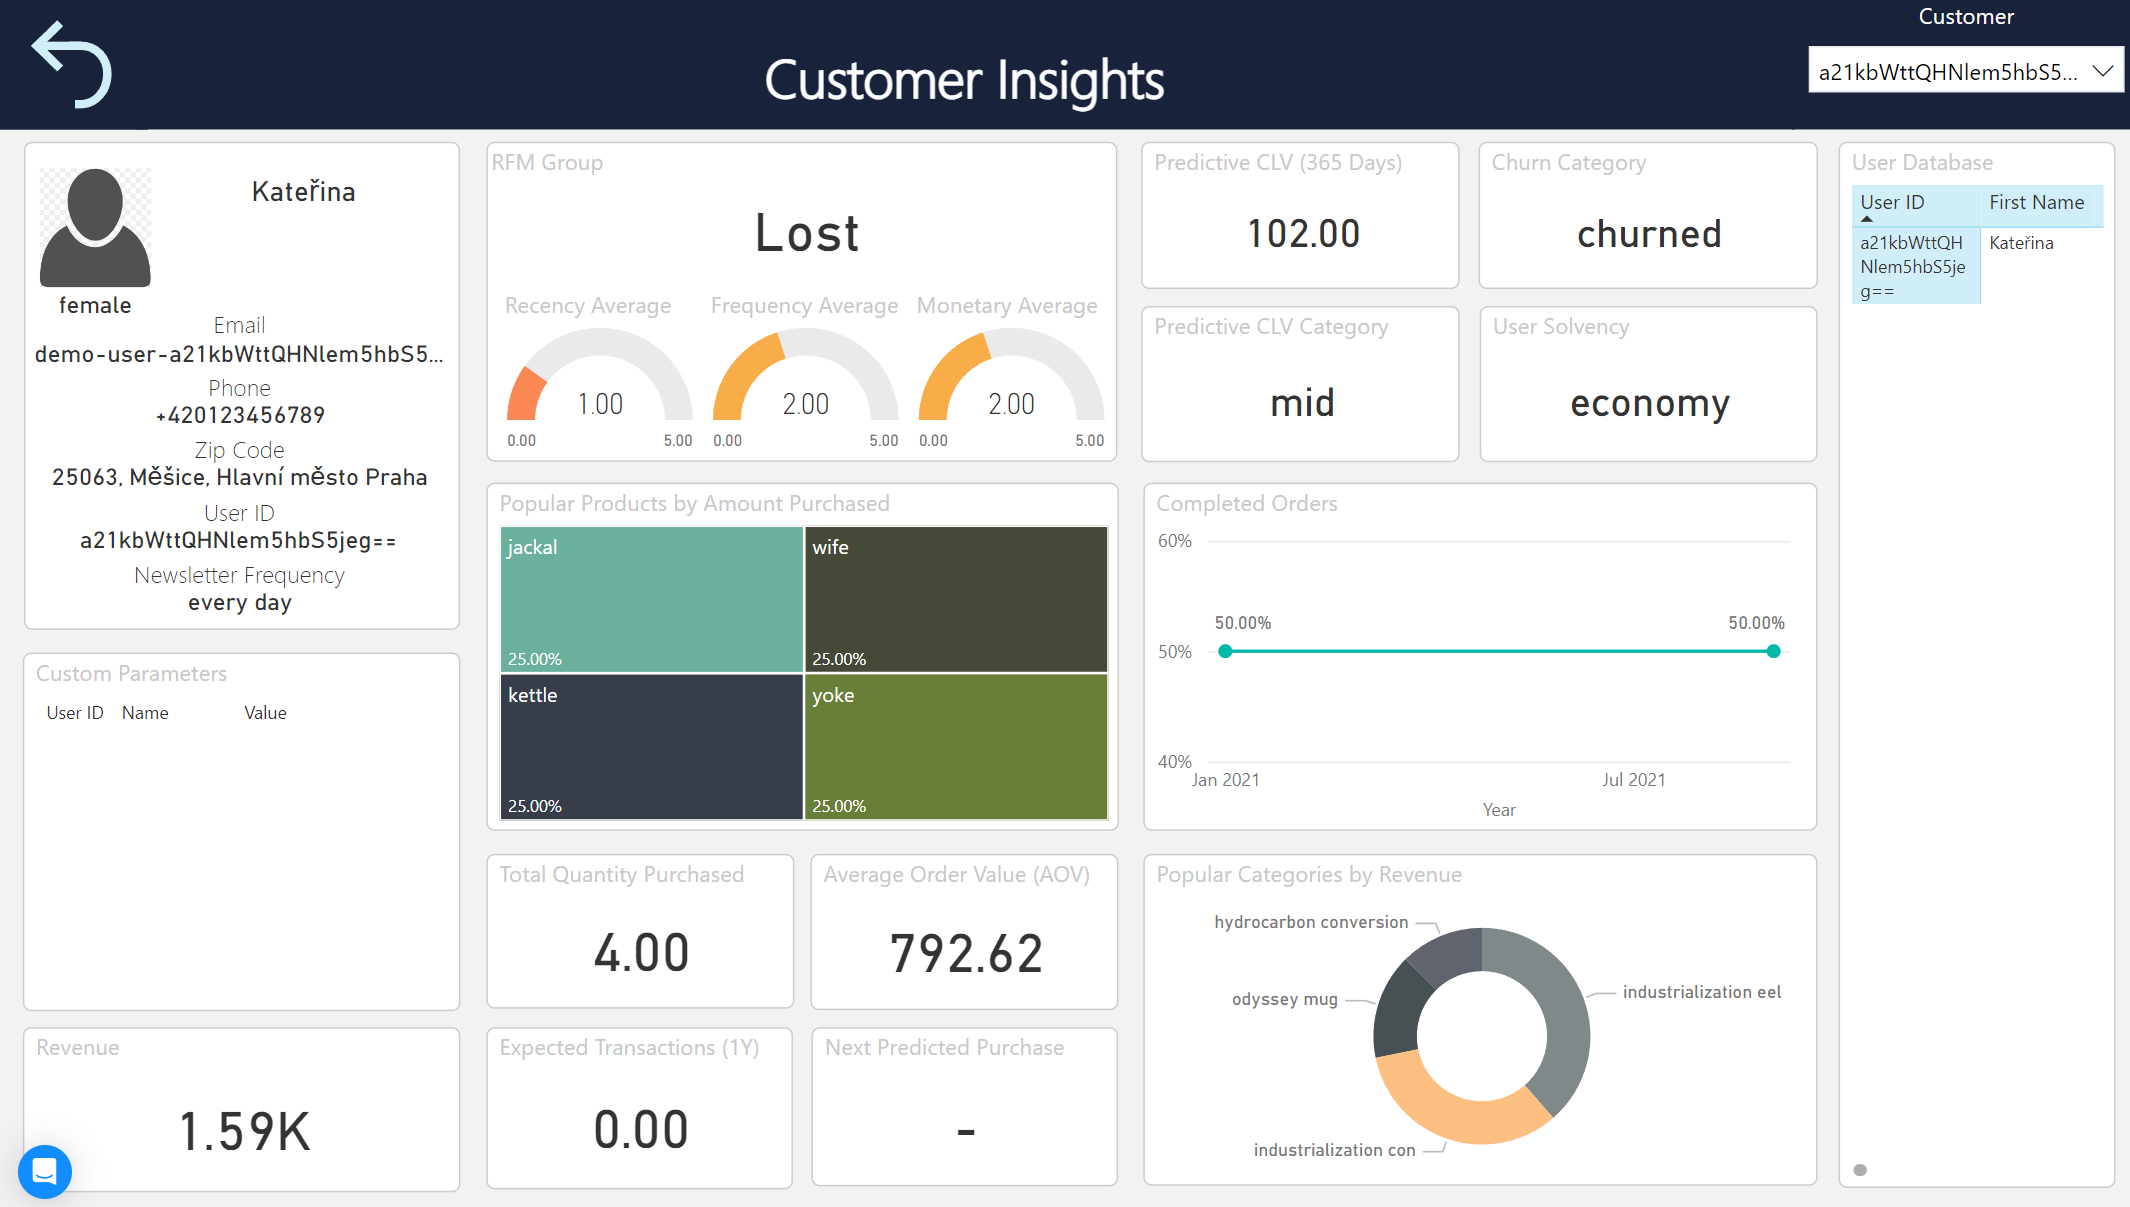
Customer
In this section, you will find a detailed 360° profile of each customer in your database. You have a detailed overview of basic personal information, but also a wide range of possibilities to analyse purchasing history and behaviour.
You can analyse:
- Total quantity of products purchased
- Total spend
- Development of completed orders over time
- Popular products by quantity purchased
- Popular product categories by sales
- Next order prediction
- and many other parameters
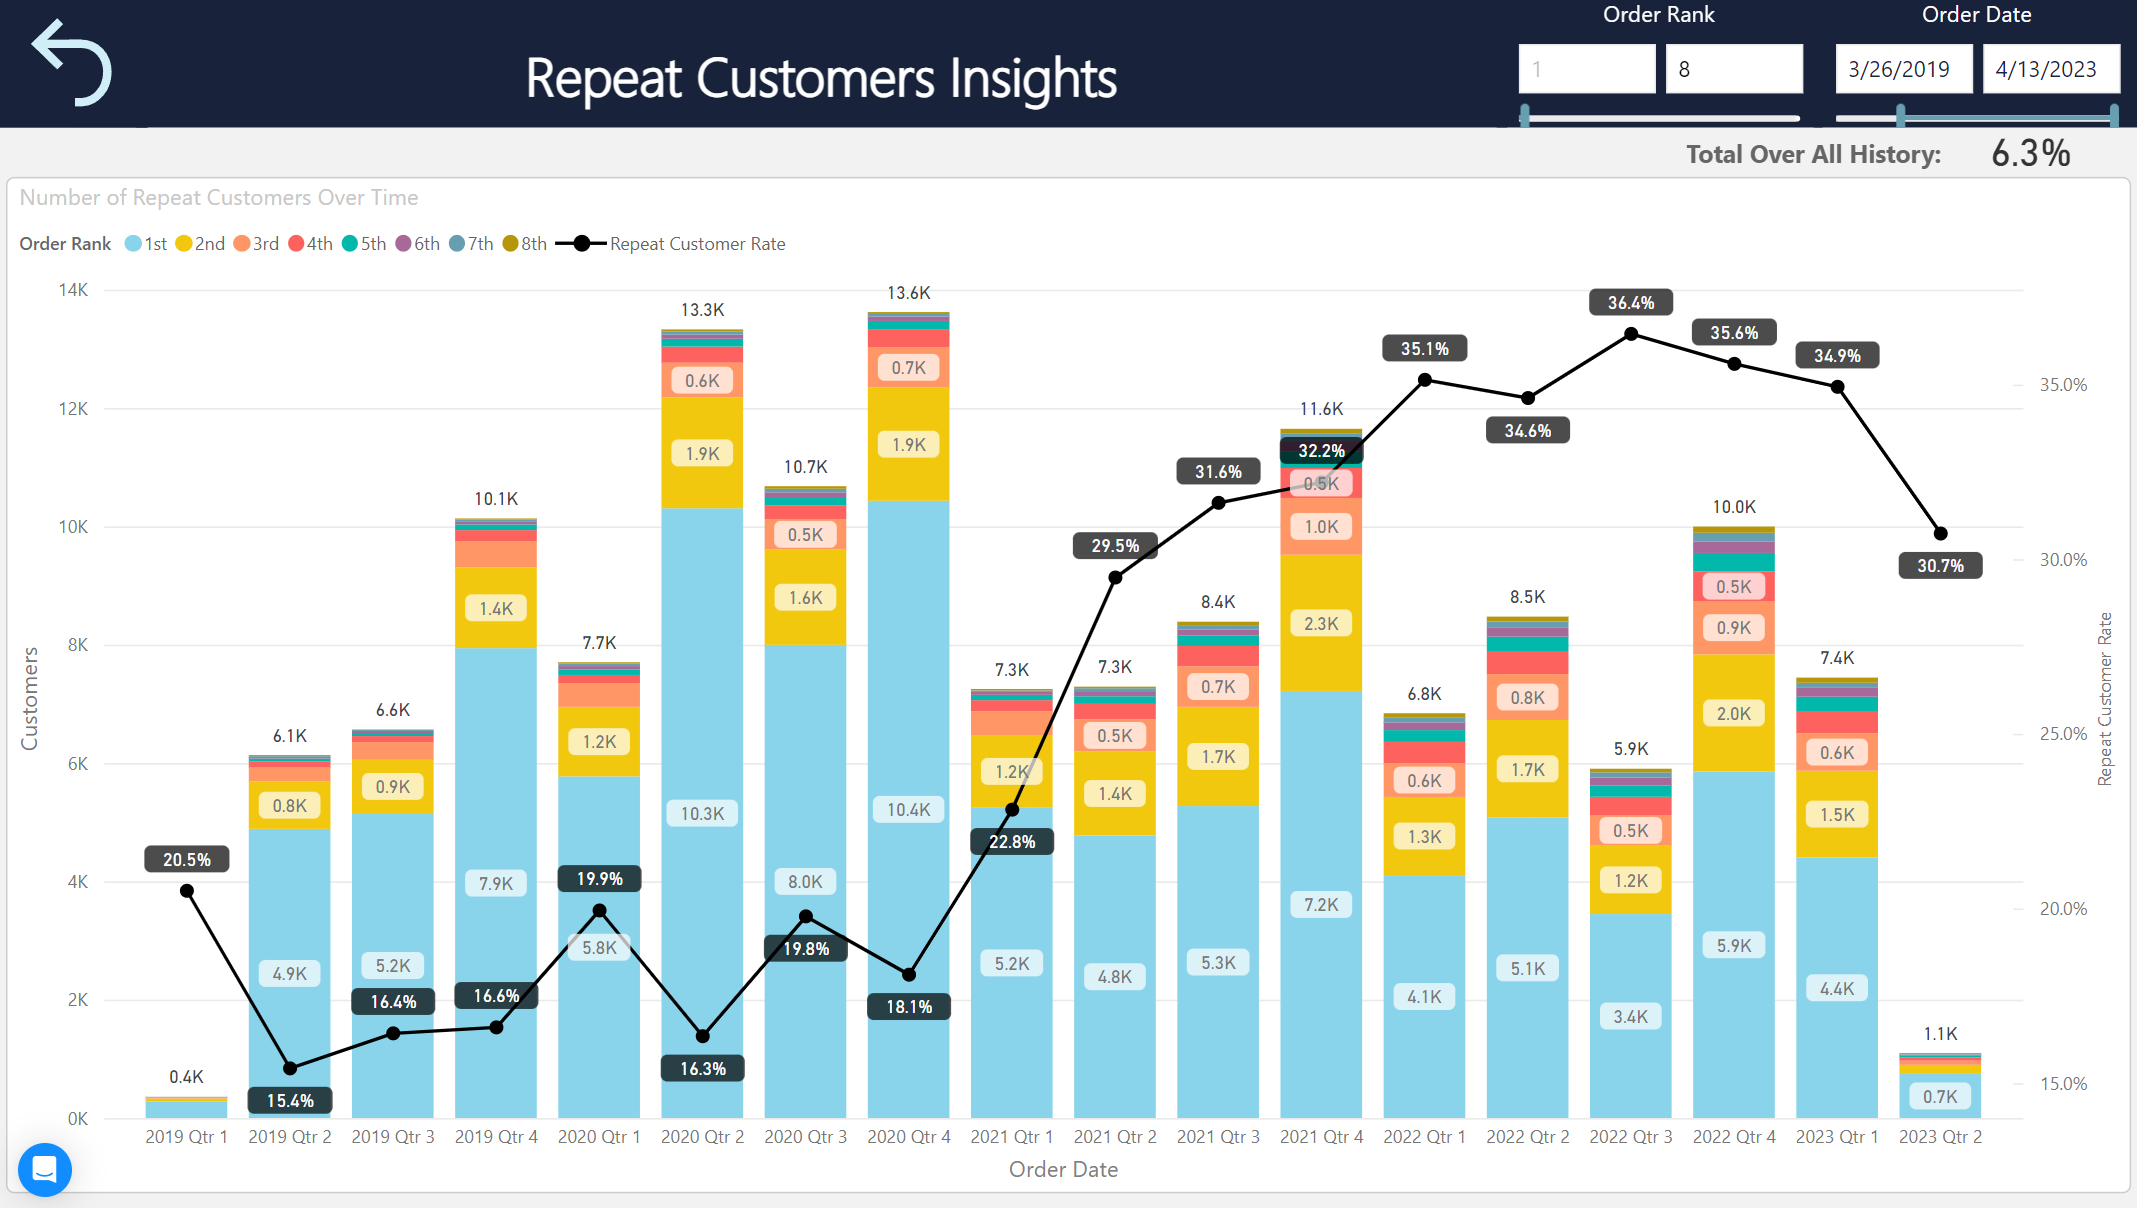
Repeat Customers
Here you will find a detailed analysis of returning customers. In addition to the overall percentage of returning customers, you can find a detailed graph that allows you to analyse the development of the number of returning customers in each quarter and thus keep your customer retention under control.
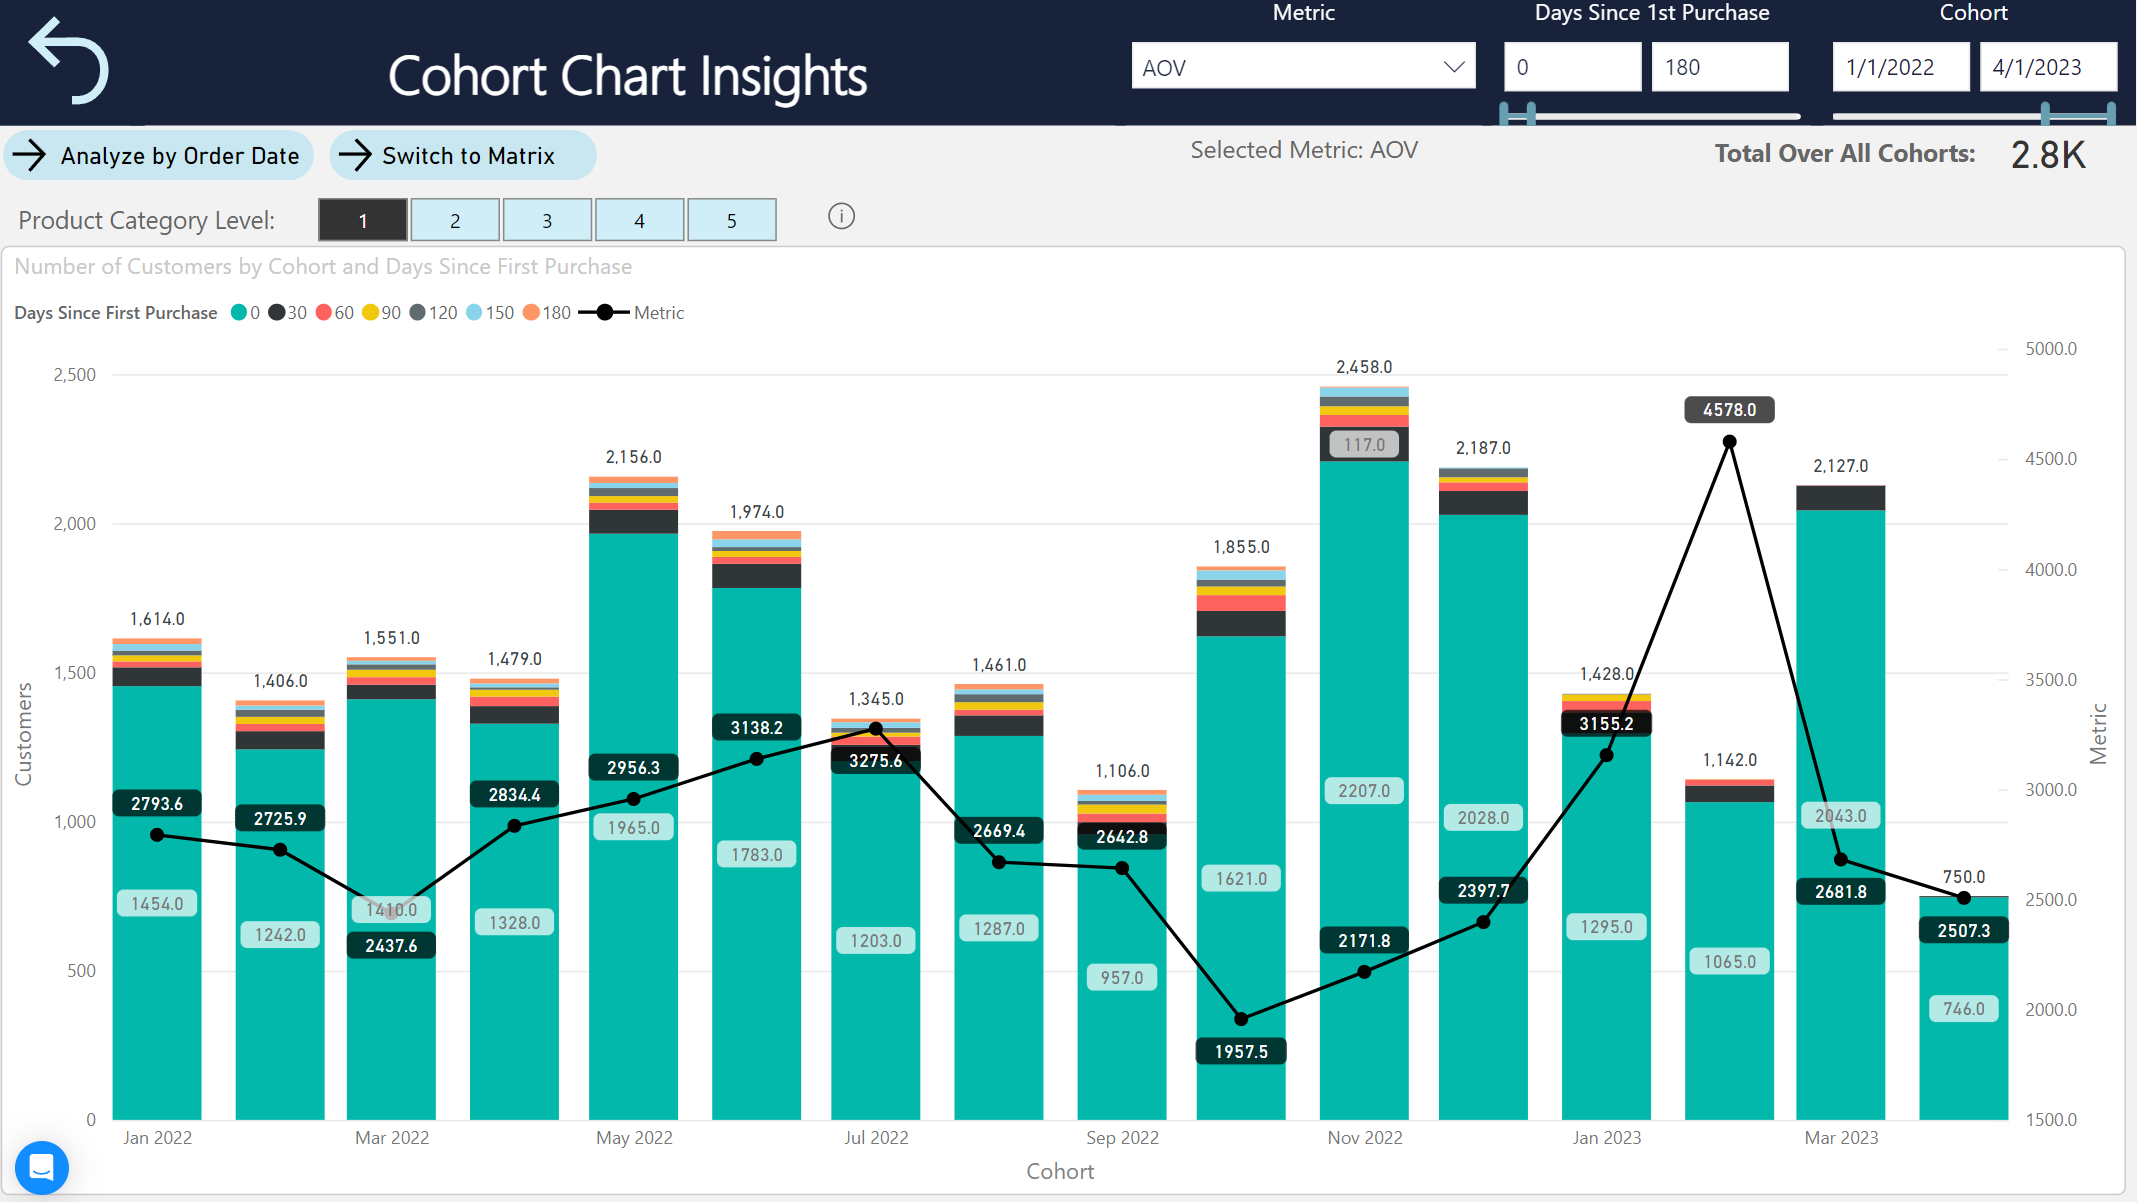
Cohort Chart
Using the graph or matrix in this section, you can track the evolution of your chosen metric (there are dozens of metrics to choose from) in relation to the number of days since the first order was placed or in relation to the date the order was placed. This is one of the most powerful tools for understanding customer behaviour and optimizing retention strategies.
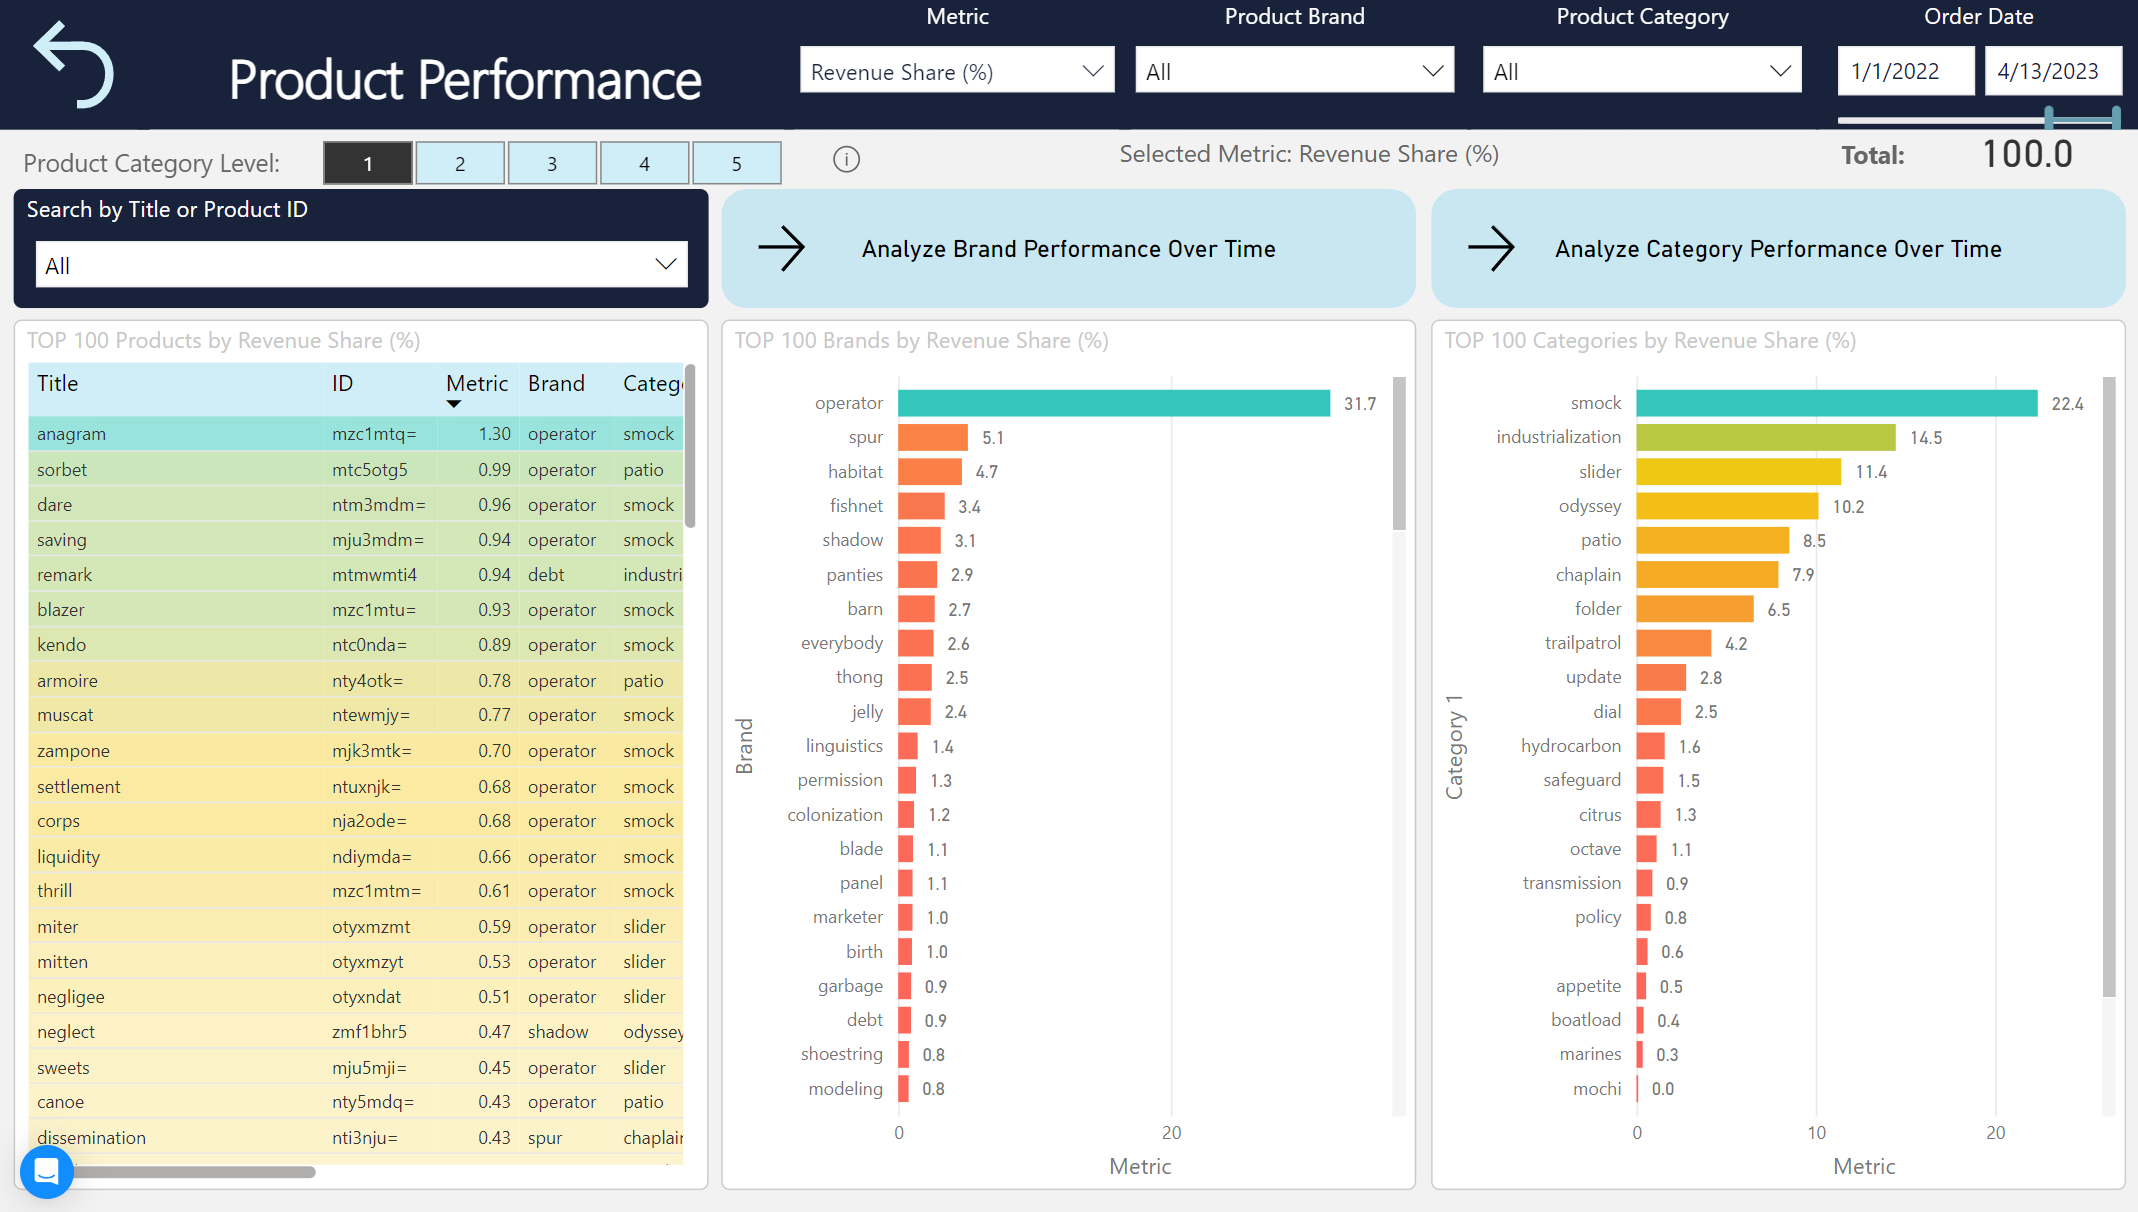
Product Performance
With Product Performance, you can analyze your product database in detail in terms of performance in the store.
You can track statistics for specific or all products, as well as analyze the performance of individual brands or product categories.
Again, possible analysis metrics include Average Order Value, Percentage of the product/brand/category in total sales, Number of customers who purchased the product/brand/category, etc.
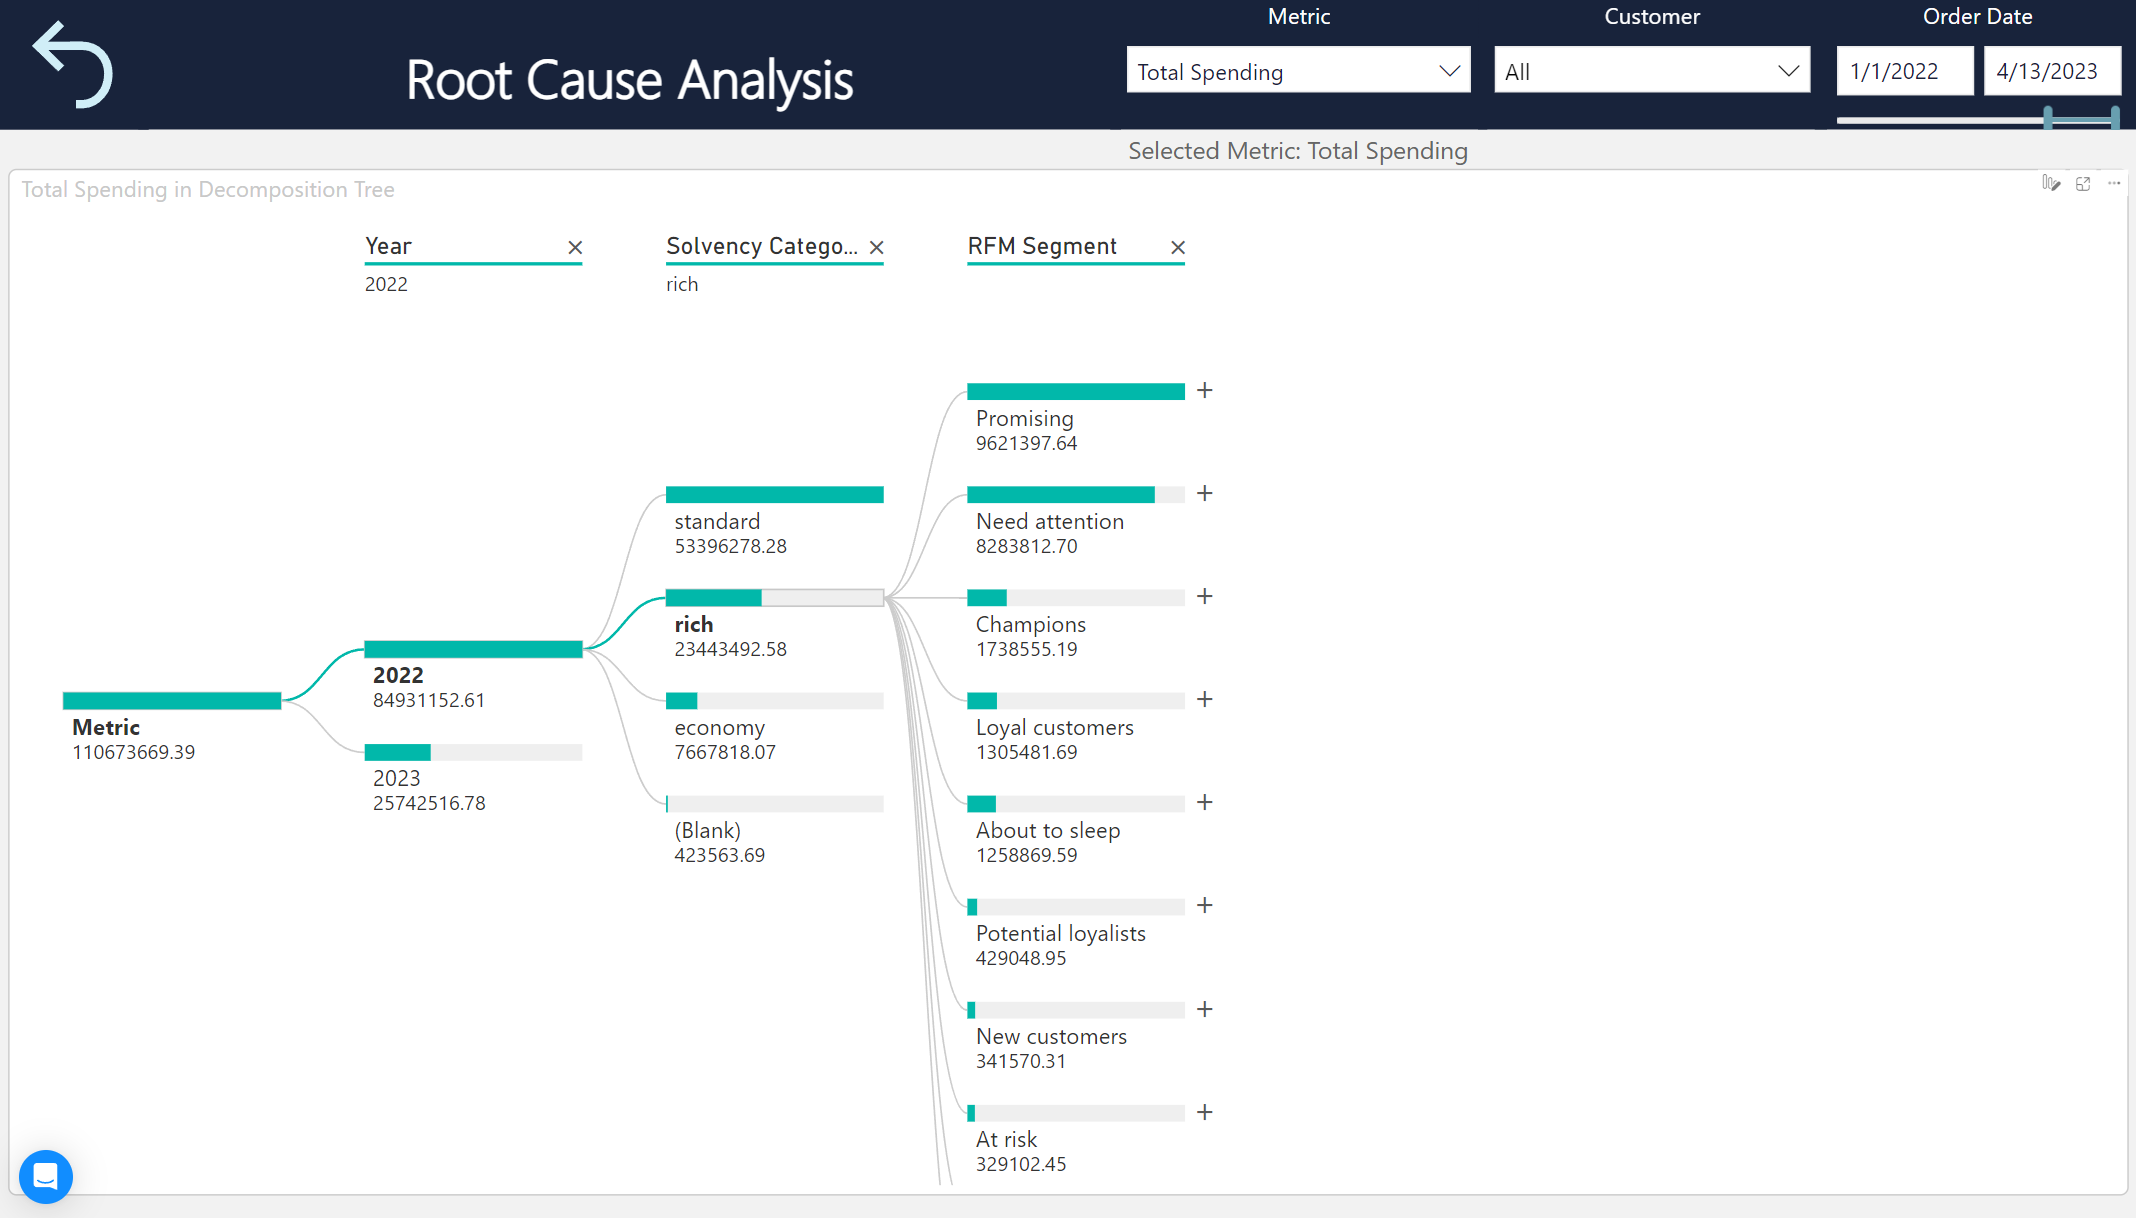
Root Cause
Root Cause Analysis allows you to get a detailed view of the decay of any metric according to selected customer attributes.
For example, you can then break down the “Total Spend” metric into individual years. Individual years further into a breakdown of total spend by representation across rating categories, or further into a breakdown of total spend across RFM segments for each rating category.
This gives you the ability to break down the selected metric to the smallest detail, answering questions that previous reports cannot explain.
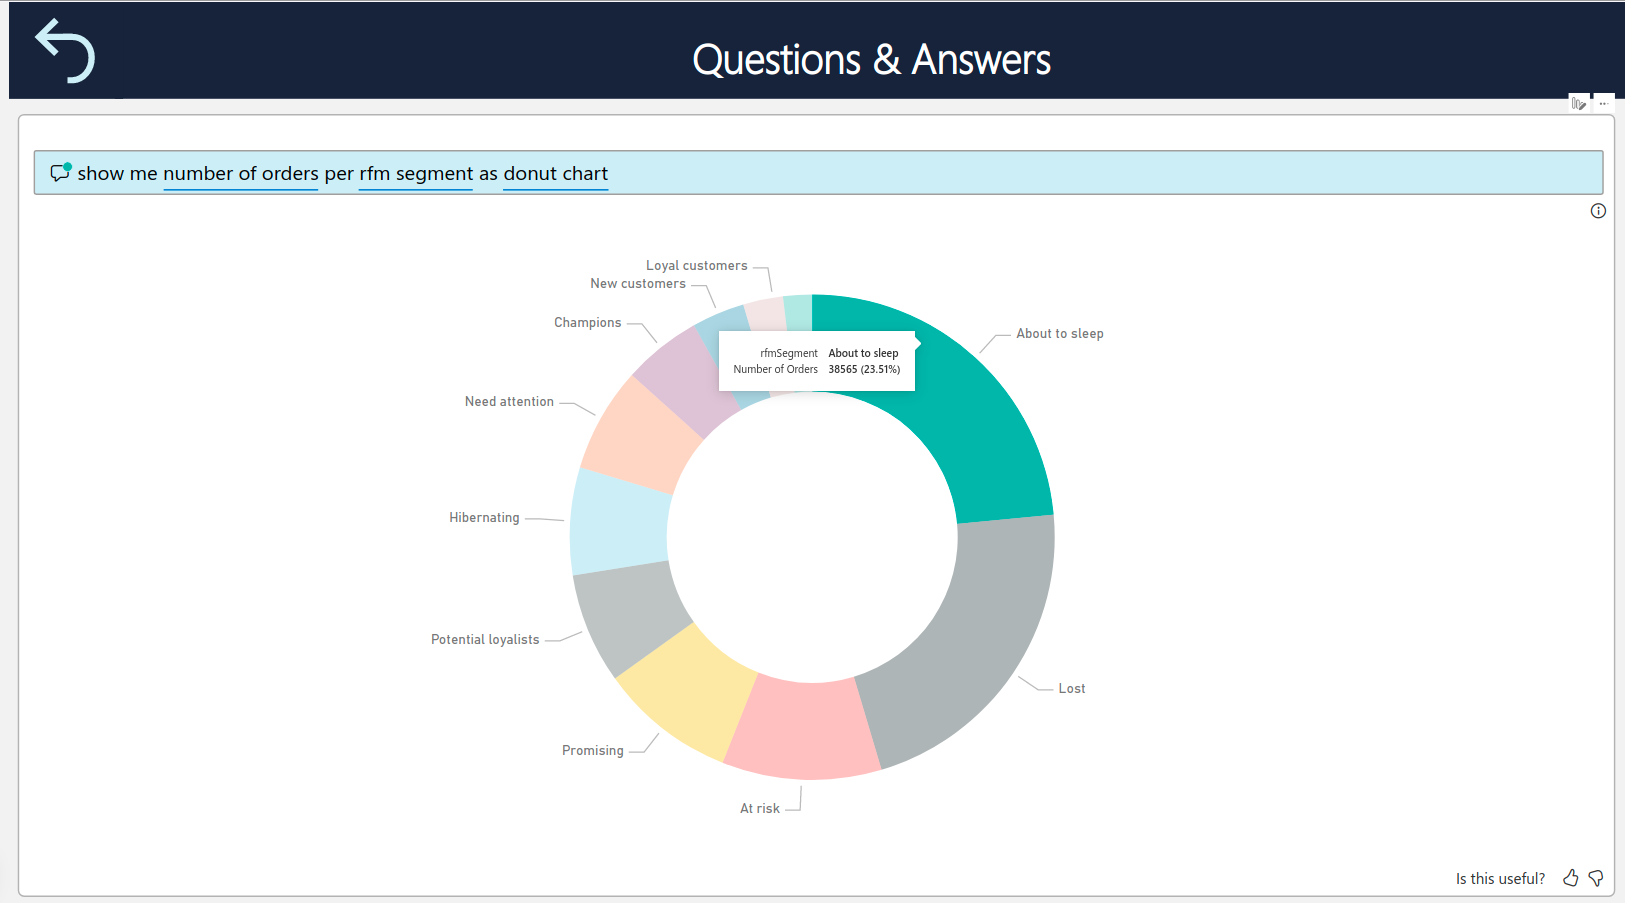
Q&A
With Q&A, you can use the analytics tool to ask in natural language the specific question you are trying to answer in analytics. The output is a report generated according to your requirements. Without any limitations, you can create custom reports tailored to your needs.
For example, querying “show me the number of orders per rfm segment as doughnut chart” will return this chart.
General information
- Reports are usually updated once a day.
- If a report has not been accessed for more than 2 months, the daily update is automatically put to sleep. When the report is accessed again, the daily update is resumed.
This post is also available in: